Abstract
Using a piecewise linear multiple change-point model instead of more traditional survival techniques is more beneficial when dealing with mortality data. Utilizing this technique, the hazard model is estimated and the number of cut-point locations is found. Using various covariates, such as sociodemographic, biological, and proximate co-factors, this piecewise hazard model is fitted to the Infant Mortality Data of Bangladesh Demographic and Health Survey 2014. Finding the change point and the impact of covariates on the hazard rate is done using the maximum likelihood estimation process. The parameter's significance is subsequently supported by the Wald test statistic. It turns out that the mother's educational status, religion, mother's age in years, the number of children they have ever had, currently breastfeeding, the size of the child, desire for more children, cesarean delivery, ANC visits, and birth orders are all significant factors. It is also discovered that the detected change point of the hazard rate is extremely important for the child until they reach the age of five. Through the various time cut points, it is found that a piecewise linear multiple change-point model is very important for under-five child mortality. Public health specialists, researchers, and clinicians can all benefit from this piecewise hazard model. One of the most crucial elements in lowering child mortality is time.
Keywords
Change Point, Hazard Rate, Infant Mortality
1. Introduction
The most significant members of society are those under the age of five. The future of the nation will be significantly impacted by its growth and development. Increasing child survival and health can help nations achieve more demographic balance. As a consequence, in the majority of industrialized and developing nations, child health is a top priority on policy agendas. Millions of children under five still pass away every year from easily avoidable causes, despite this. An essential public health objective is the advancement of medicine in the fight against infant mortality. New developments in clinical trials frequently result in a considerable increase in newborn survival. A better understanding of how medical advancements, therapies, or interventions affect patient populations' survival rates by presenting a worldwide picture of infant mortality survival trends in the general population can be gained. The study's technique is applied to survival data to determine the locations of trends in infant mortality and hazard function trends.
In the field of change point estimation, a lot of information is available regarding piecewise constant exponential models with a single change point. Several biostatisticians have extensively studied the estimation and testing in a piecewise constant model with one change point in parametric and semi-parametric approaches employing likelihood-ratio type tests, score tests, and Bayesian tests.
It is first stated that there is a change score for hazard functions in a partial parametric constant model while examining the time to failure of individuals with non-lymphoblastic leukemia. They used likelihood ratio type testing to determine the change point.
To find the change point, they employed likelihood ratio type testing is employed. However, at 182 days, data from 24 observations of non-lymphoblastic patients were censored. This censored data was not taken into account in the analysis. The study claimed that the likelihood ratio test findings were not substantially impacted by removing this data
| [1] | Matthews, David E., & Farewell, V. T. On testing for a constant hazard against a change-point alternative. Biometrics, 1982, 38(2), 463. https://doi.org/10.2307/2530460 |
[1]
.
From this point forward, the majority of the subsequent work develops hypotheses by altering the probability calculation for censored information or deleting censored information while focusing on the observable survival time variable. Later, the unboundedness aspect of the probability is investigated when the alter point approaches the maximum observation of the failure times
| [2] | Nguyen, H. T., Rogers, G. S., & Walker, E. A. Estimation in change-point hazard rate models. Biometrika, 1984, 71(2), 299. https://doi.org/10.2307/2336246 |
[2]
.
A study examined tests based on the maximal score statistic and found a relationship between the typical Brownian bridge and the Ornstein-Uhlenbeck preparation, as well as the normalized score handle's asymptotic limiting process
| [3] | Matthews, D. E., & Farewell, V. T. On a singularity in the likelihood for a change-point hazard rate model. Biometrika, 1985, 72(3), 703. https://doi.org/10.2307/2336749 |
[3]
.
Assuming T(n-1) to be the second-largest observation, maximizing the log-likelihood function in the change point over [0, T(n-1)], and providing the asymptotic properties of the estimators for the piecewise hazard functions as well as the change point was proposed
.
Later, to verify that the likelihood function at the change point is finite, the precise critical values of the maximum likelihood estimator are computed over the following three intervals: (i) [0, T(n-1)], (ii) [p
th sample quantile, (1-p)
th sample quantile], and the greatest observation is censored.
| [5] | Worsley, K. J. Exact percentage points of the likelihood-ratio test for a change-point hazard-rate model. Biometrics, 1988, 44(1), 259. https://doi.org/10.2307/2531914 |
[5]
To provide a likelihood-ratio test, the model with and without censoring for i.i.d. event periods is tested. This investigation provided joint and approximate confidence zones for the change point and the size of change over another interval
A recent study addressed estimates using a semi-parametric technique with censoring
| [7] | Pons, O. Estimation in a cox regression model with a change-point at an unknown time. Statistics, 2002, 36(2), 101–124. https://doi.org/10.1080/02331880212043 |
| [8] | Zhao, X., Wu, X., Zhou, X. A change-point model for survival data with long-term survivors. Statistica Sinica, 2009, 19(1), 377–390. |
[7, 8]
. The estimation of the change point for the hazard functions is also examined based on the estimated cumulative hazard, which combines the martingale technique with censoring and the least squared principle
.
While there is a wealth of literature on single change point hazards, there is a dearth of information on multiple change point issues. To the best of knowledge, published works on multiple change points hazard concerns have been done in two studies
| [10] | Goodman, M. S., Li, Y., Tiwari, R. C. Survival analysis with change point hazard functions. Tech. rep., Harvard University Biostatistics Working Paper Series, 2006, Working Paper 40, http://biostats.bepress.com/cgi/viewcontent.cgi?article=1043&context=harvardbiostat |
| [11] | Goodman, M. S., Li, Y., & Tiwari, R. C. Detecting multiple change points in piecewise constant hazard functions. Journal of Applied Statistics, 2011, 38(11), 2523–2532. https://doi.org/10.1080/02664763.2011.559209 |
| [12] | Qian, L., & Zhang, Multiple change-point detection in piecewise exponential hazard regression models with long-term survivors and right censoring. Contemporary Developments in Statistical Theory, 2013. 289–304. https://doi.org/10.1007/978-3-319-02651-0_18 |
[10-12]
. An algorithm was presented to fit both susceptible and long-term survivors with observable covariates using a grid search weighted least squared method to discover and estimate the number of change points in the hazard functions. All possible change points are assumed to fall inside a specific, known interval [B1, B2] in this strategy. This is a simulation study with minimal theoretical content, and assuming a predetermined interval for change points makes the application much less viable
An extensive study proposed a methodology for estimating multiple change points using the Nelder-Mead Simplex algorithm and a model selection approach using sequential testing with likelihood ratio test and Wald-type test statistics in the piecewise constant hazard model and piecewise linear hazard model for random right censored data
. Covariate additions will readily fit into the updated model. When estimating multiple change points, the Nelder-Mead Simplex algorithm can accommodate an infinite number of co-variates, however, it can only handle additive variables. In the Bayesian framework, a Bayesian approach for multiple change-point estimation using Gibb’s sampling is also used
| [13] | Arjas, E. and Gasbarra, D. Nonparametric bayesian inference from right censored survival data, using the gibbs sampler. Statistica Sinica, 1994, 4, 505–524. |
[13].
After that a stochastic approximation Monte Carlo algorithm to identify which particular number and location of change-points gives the highest log-posterior values but does not present the relative probabilities of models with different numbers of changepoints
| [14] | Kim, J., Cheon, S., and Jin, Z. Bayesian multiple change-points estimation for hazard with censored survival data from exponential distributions. Journal of the Korean Statistical Society, 2020, 49, 15–31. |
[14].
Later, both the uncertainty in the change-point locations and hazards for a given change-point model are estimated by a reversible jump algorithm to a collapsed change-point model, and a probabilistic interpretation for the number of change-points is also obtained
In this case, the piecewise linear multiple change-point model is selected through sequential testing with Wald-type test statistics, and the methodology is used to estimate the change points in the hazard rate of child death.
Now, the popular Cox hazard model is written as
Here, t’s are observed times; z’s be the vector of covariates and β be the regression coefficients.
In the Cox proportional model, the baseline hazard is assumed to be fixed. Nonetheless, the hazard function—which shows the immediate chance of failure at a given point in time—is an essential component of survival analysis. Although popular survival strategies such as the Cox proportional hazards model do not require explicit estimation of the hazard function, there are some situations in which it is useful. This is because the Cox proportional hazards model focuses more on the impact of the covariates on the hazard function. Models of change-point hazard rates are one type of this. These models presuppose the existence of a function with different time-varying hazard rates. These intervals, which are unknown and need estimation, are frequently referred to as the "change points."
Considering three change points and by taking logarithm on both sides of the equation (
1), the equation for the piecewise linear multiple change-point model can be derived which is given below: -
(2)
Here, α’s are hazard rates for a particular time interval or until a change point is detected and τ’s are change points.
Again let, Ci be the censoring times and δi be the censoring indicators. Then the loglikelihood function for the model is given by
(3)
2. Materials and Methods
To examine infant mortality in Bangladesh, the BDHS 2014 data set from The DHS program conducted by USAID is used. For conducting survival analysis, the child's age in months is taken as survival time, and status is denoted by whether the child is alive or not. Moreover, two types of variables such as socioeconomic and demographic variables, and Proximate and Biological factors as covariates are listed below:
Table 1. List of Covariates.
Demographic & Socio-economic Variables | Proximate and Biological variables |
Educational Status | Currently Breastfeeding |
Religion | Desire for more children |
Woman's age in years | Size of child |
| ANC Visits |
| Birth order |
| Delivery by caesarean section |
| Total children ever born |
2.2. Estimation Procedure
The maximum likelihood estimation method is used to estimate the parameter of the loglikelihood function stated in equation (
3). R-programming language is used to conduct the estimation procedure.
2.3. Testing the Significance of the Estimates
Examining model (
2) for change points is of interest to us. Testing if the risk before and after such points are equal would be an equivalent hypothesis. The null hypothesis can be tested that
or
in order to compare the option of one change point with the null hypothesis of no change points. To assess a linear combination, using of a Wald test statistic is suggested here.
The following Wald test statistic can be used to test a hypothesis of the form
, given
where is an matrix, , and M is the solution vector. The suggested approach is a step-by-step process even though it involves many tests. As a result, more than one hypothesis at once is never tested. To test versus a Wald type test statistic of the form is used,
3. Results and Discussion
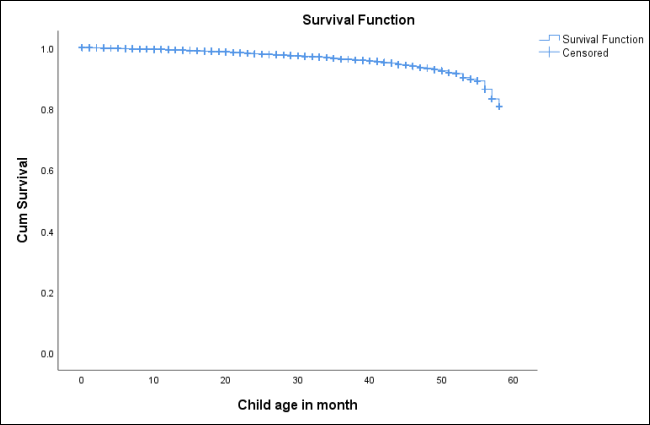
3.1. Survival Status of Child
The survival status of children under five is displayed in
Table 2. Despite the censorship of 96% of the sample, the size of the sample allows for sufficient events to be analyzed. The plot displays the children's survival probability and censor cases report; the censor in the graph is represented by the + symbol. The total survival time of the children is 58 months (
Figure 1).
Table 2. Condition of under-five-year-old children's survival.
Total N | No of deaths | Censored |
| | N | Percent |
7760 | 314 | 7446 | 96.00% |
Figure 1. Child survival status.
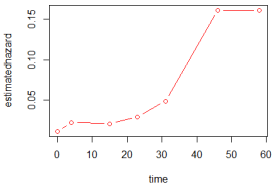
Still, figuring out how many change points there are and where they are is a matter of interest. Using Nelder Mead Simplex algorithm through R programming an estimated hazard function is obtained which is shown in
Figure 2.
Figure 2. Estimated Infant Mortality Hazard Function.
By utilizing the suggested approach, it is found that the hazard function has five change points (namely at 3.95, 14.99, 22.99, 30.99 and 45.99 months) and is defined by Equation (
4).
) (4)
Later, testing the significance of the change points by the Wald test as stated above is done. The result of the Wald Test for the significance of the change points is given below: -
Table 3. Results of Wald test.
Null Hypothesis | Wald Test Statistic | P-value |
| 179.164 | 0.0000*** |
| 2.941 | 0.0863** |
| 52.283 | 0.0000*** |
| 179.335 | 0.0000*** |
| 741.585 | 0.0000*** |
‘***’ and ‘**’ denote rejection of hypothesis under 5% and 10% level of significance respectively.
After that, the model with the covariates as stated above is fitted, and the coefficients of the covariates are given below: -
Table 4. Socioeconomic and demographic variables as covariates.
Covariate | Coeff | Exp (Coeff) | Wald P |
Educational Status | 0.02926104 | 1.02969 | 0 |
Religion | -0.00544255 | 0.99457 | 0 |
Woman's age in years | -0.02450831 | 0.97578 | 0 |
Table 5. Proximate and Biological factors as covariates.
Covariate | Coeff | Exp (Coeff) | Wald P |
Currently Breastfeeding | 0.652956 | 1.9212 | 0 |
Desire for more children | 0.007533 | 1.0075 | 0 |
Size of child | 0.024365 | 1.0246 | 0 |
ANC Visits | -0.050064 | 0.9511 | 0 |
Birth order | 0.693071 | 1.9998 | 0 |
Delivery by caesarean section | 0.056475 | 1.0581 | 0 |
Total children ever born | -0.719095 | 0.4871 | 0 |
4. Discussion
The hazard function increases gradually up to the first change point, then sharply decreases till the second change point, increases gradually up to the fourth change point, and then sharply increases until the fifth change point. From the above result of the Wald Test, it is clear that the hazard rate between the interval between 0 to 3.95 months is not the same as the hazard rate between the interval between 3.95 months and 14.99 months. Moreover, the hazard rate between the interval 14.99 months and 22.99 months is not the same as the hazard rate between the interval 22.99 months and 30.99 months, and the same result for the interval between (22.99, and 30.99) months and (30.99 and 45.99). So there exist 5 change points.
By utilizing the suggested method, it is found that the hazard function has five change points 3.95, 14.99, 22.99, 30.99, and 45.99 months respectively which means in those time points infants need more care till completing five years of age.
Table 4 finds that the educational level, women's age, and religion of the respondents are significant factors in the piecewise linear multiple change-point model.
Table 5 shows all proximate and biological factors such as total children ever born, present breastfeeding, desire for more children, size of the child, delivery by cesarean section, ANC visits, and birth orders are statistically significant in the piecewise linear multiple change-point model of the child mortality status.
5. Conclusions
In the last few years, statisticians have created various techniques for analyzing data in the area of survival analysis. Estimating the survival function, determining the risk and prognostic variables of a specific disease, and establishing the correlations between the risk factors and the response or disease variable over time are the key goals of the survival analysis.
However, it is no longer limited in terms of determining the risk factor. These days, determining the hazard rate's time or change point is of scientific interest. The Cox proportional hazard model assumes a constant baseline risk across time, which is unrealistic for serious illnesses like HIV, cancer, and other diseases that take lives. That’s why in this study “Piecewise linear multiple change point Model” to analyze the infant mortality data is considered.
The data on under-five child mortality from the Bangladesh Demographic and Health Survey 2014 using the proposed model is fitted. This technique actualizes and plays a significant role in survival models, especially at different time cut points. The model is very helpful in estimating the patient risk at various times. The crucial month period and influencing factors for under-five child mortality were found using the piecewise multiple change-point model for the first time in the case of Bangladesh. These results can be used to establish time intervals for evaluating the survival status of children under five in this study.
Some basic approaches are provided that can be applied to many additional relevant situations, using Wald-type test statistics and maximum likelihood estimation. The resulting hazard function estimate permits non-parametric extrapolation of very long-term survival by extending the trend from the last change point. This hazard function estimate can also be used for prediction. Decisions about health care policy may be impacted by change-point hazard functions. In the future one can compare the hazard rate of the same interval with another country to reach the sustainable development goals. The proposed comprehension of population death rate trends can help us find gaps, investigate remedies, boost output, and ultimately improve public health.
Abbreviations
ANC visits: Antenatal Care Visits
i.i.d.: Independently and Identically Distributed
Conflicts of Interest
The authors declare no competing interests.
References
| [1] |
Matthews, David E., & Farewell, V. T. On testing for a constant hazard against a change-point alternative. Biometrics, 1982, 38(2), 463.
https://doi.org/10.2307/2530460
|
| [2] |
Nguyen, H. T., Rogers, G. S., & Walker, E. A. Estimation in change-point hazard rate models. Biometrika, 1984, 71(2), 299.
https://doi.org/10.2307/2336246
|
| [3] |
Matthews, D. E., & Farewell, V. T. On a singularity in the likelihood for a change-point hazard rate model. Biometrika, 1985, 72(3), 703.
https://doi.org/10.2307/2336749
|
| [4] |
Yao, Y.-C. Maximum likelihood estimation in hazard rate models with a change-point. Communications in Statistics -Theory and Methods, 1986, 15(8), 2455–2466.
https://doi.org/10.1080 /03610928608829261
|
| [5] |
Worsley, K. J. Exact percentage points of the likelihood-ratio test for a change-point hazard-rate model. Biometrics, 1988, 44(1), 259.
https://doi.org/10.2307/2531914
|
| [6] |
Loader, C. R. Inference for a hazard rate change point. Biometrika, 1991, 78(4), 749.
https://doi.org/10.2307/2336926
|
| [7] |
Pons, O. Estimation in a cox regression model with a change-point at an unknown time. Statistics, 2002, 36(2), 101–124.
https://doi.org/10.1080/02331880212043
|
| [8] |
Zhao, X., Wu, X., Zhou, X. A change-point model for survival data with long-term survivors. Statistica Sinica, 2009, 19(1), 377–390.
|
| [9] |
Gijbels, I., & Gürler, Ü. Estimation of a change point in a hazard function based on censored data. Lifetime Data Analysis, 2003, 9(4), 395–411.
https://doi.org/10.1023/b:lida.0000012424.71723.9d
|
| [10] |
Goodman, M. S., Li, Y., Tiwari, R. C. Survival analysis with change point hazard functions. Tech. rep., Harvard University Biostatistics Working Paper Series, 2006, Working Paper 40,
http://biostats.bepress.com/cgi/viewcontent.cgi?article=1043&context=harvardbiostat
|
| [11] |
Goodman, M. S., Li, Y., & Tiwari, R. C. Detecting multiple change points in piecewise constant hazard functions. Journal of Applied Statistics, 2011, 38(11), 2523–2532.
https://doi.org/10.1080/02664763.2011.559209
|
| [12] |
Qian, L., & Zhang, Multiple change-point detection in piecewise exponential hazard regression models with long-term survivors and right censoring. Contemporary Developments in Statistical Theory, 2013. 289–304.
https://doi.org/10.1007/978-3-319-02651-0_18
|
| [13] |
Arjas, E. and Gasbarra, D. Nonparametric bayesian inference from right censored survival data, using the gibbs sampler. Statistica Sinica, 1994, 4, 505–524.
|
| [14] |
Kim, J., Cheon, S., and Jin, Z. Bayesian multiple change-points estimation for hazard with censored survival data from exponential distributions. Journal of the Korean Statistical Society, 2020, 49, 15–31.
|
| [15] |
Cooney, P. and White, A., Change-point Detection for Piecewise Exponential Models, 2021.
https://doi.org/10.48550/arXiv. 2112.03962
|
Cite This Article
-
-
@article{10.11648/j.jgo.20241202.11,
  author = {Sukanta Chakraborty and Soma Chowdhury Biswas},
  title = {Piecewise Linear Multiple Change Point Modelling for Under-Five Child Mortality
},
  journal = {Journal of Gynecology and Obstetrics},
  volume = {12},
  number = {2},
  pages = {14-19},
  doi = {10.11648/j.jgo.20241202.11},
  url = {https://doi.org/10.11648/j.jgo.20241202.11},
  eprint = {https://article.sciencepublishinggroup.com/pdf/10.11648.j.jgo.20241202.11},
  abstract = {Using a piecewise linear multiple change-point model instead of more traditional survival techniques is more beneficial when dealing with mortality data. Utilizing this technique, the hazard model is estimated and the number of cut-point locations is found. Using various covariates, such as sociodemographic, biological, and proximate co-factors, this piecewise hazard model is fitted to the Infant Mortality Data of Bangladesh Demographic and Health Survey 2014. Finding the change point and the impact of covariates on the hazard rate is done using the maximum likelihood estimation process. The parameter's significance is subsequently supported by the Wald test statistic. It turns out that the mother's educational status, religion, mother's age in years, the number of children they have ever had, currently breastfeeding, the size of the child, desire for more children, cesarean delivery, ANC visits, and birth orders are all significant factors. It is also discovered that the detected change point of the hazard rate is extremely important for the child until they reach the age of five. Through the various time cut points, it is found that a piecewise linear multiple change-point model is very important for under-five child mortality. Public health specialists, researchers, and clinicians can all benefit from this piecewise hazard model. One of the most crucial elements in lowering child mortality is time.
},
 year = {2024}
}
 Copy
|
Copy
|
 Download
-
TY  - JOUR
T1  - Piecewise Linear Multiple Change Point Modelling for Under-Five Child Mortality

AU  - Sukanta Chakraborty
AU  - Soma Chowdhury Biswas
Y1  - 2024/04/02
PY  - 2024
N1  - https://doi.org/10.11648/j.jgo.20241202.11
DO  - 10.11648/j.jgo.20241202.11
T2  - Journal of Gynecology and Obstetrics
JF  - Journal of Gynecology and Obstetrics
JO  - Journal of Gynecology and Obstetrics
SP  - 14
EP  - 19
PB  - Science Publishing Group
SN  - 2376-7820
UR  - https://doi.org/10.11648/j.jgo.20241202.11
AB  - Using a piecewise linear multiple change-point model instead of more traditional survival techniques is more beneficial when dealing with mortality data. Utilizing this technique, the hazard model is estimated and the number of cut-point locations is found. Using various covariates, such as sociodemographic, biological, and proximate co-factors, this piecewise hazard model is fitted to the Infant Mortality Data of Bangladesh Demographic and Health Survey 2014. Finding the change point and the impact of covariates on the hazard rate is done using the maximum likelihood estimation process. The parameter's significance is subsequently supported by the Wald test statistic. It turns out that the mother's educational status, religion, mother's age in years, the number of children they have ever had, currently breastfeeding, the size of the child, desire for more children, cesarean delivery, ANC visits, and birth orders are all significant factors. It is also discovered that the detected change point of the hazard rate is extremely important for the child until they reach the age of five. Through the various time cut points, it is found that a piecewise linear multiple change-point model is very important for under-five child mortality. Public health specialists, researchers, and clinicians can all benefit from this piecewise hazard model. One of the most crucial elements in lowering child mortality is time.

VL  - 12
IS  - 2
ER  -
Copy
|
Download